

Static Pressure vs. Airflow How to Read an Industrial Fan Curve
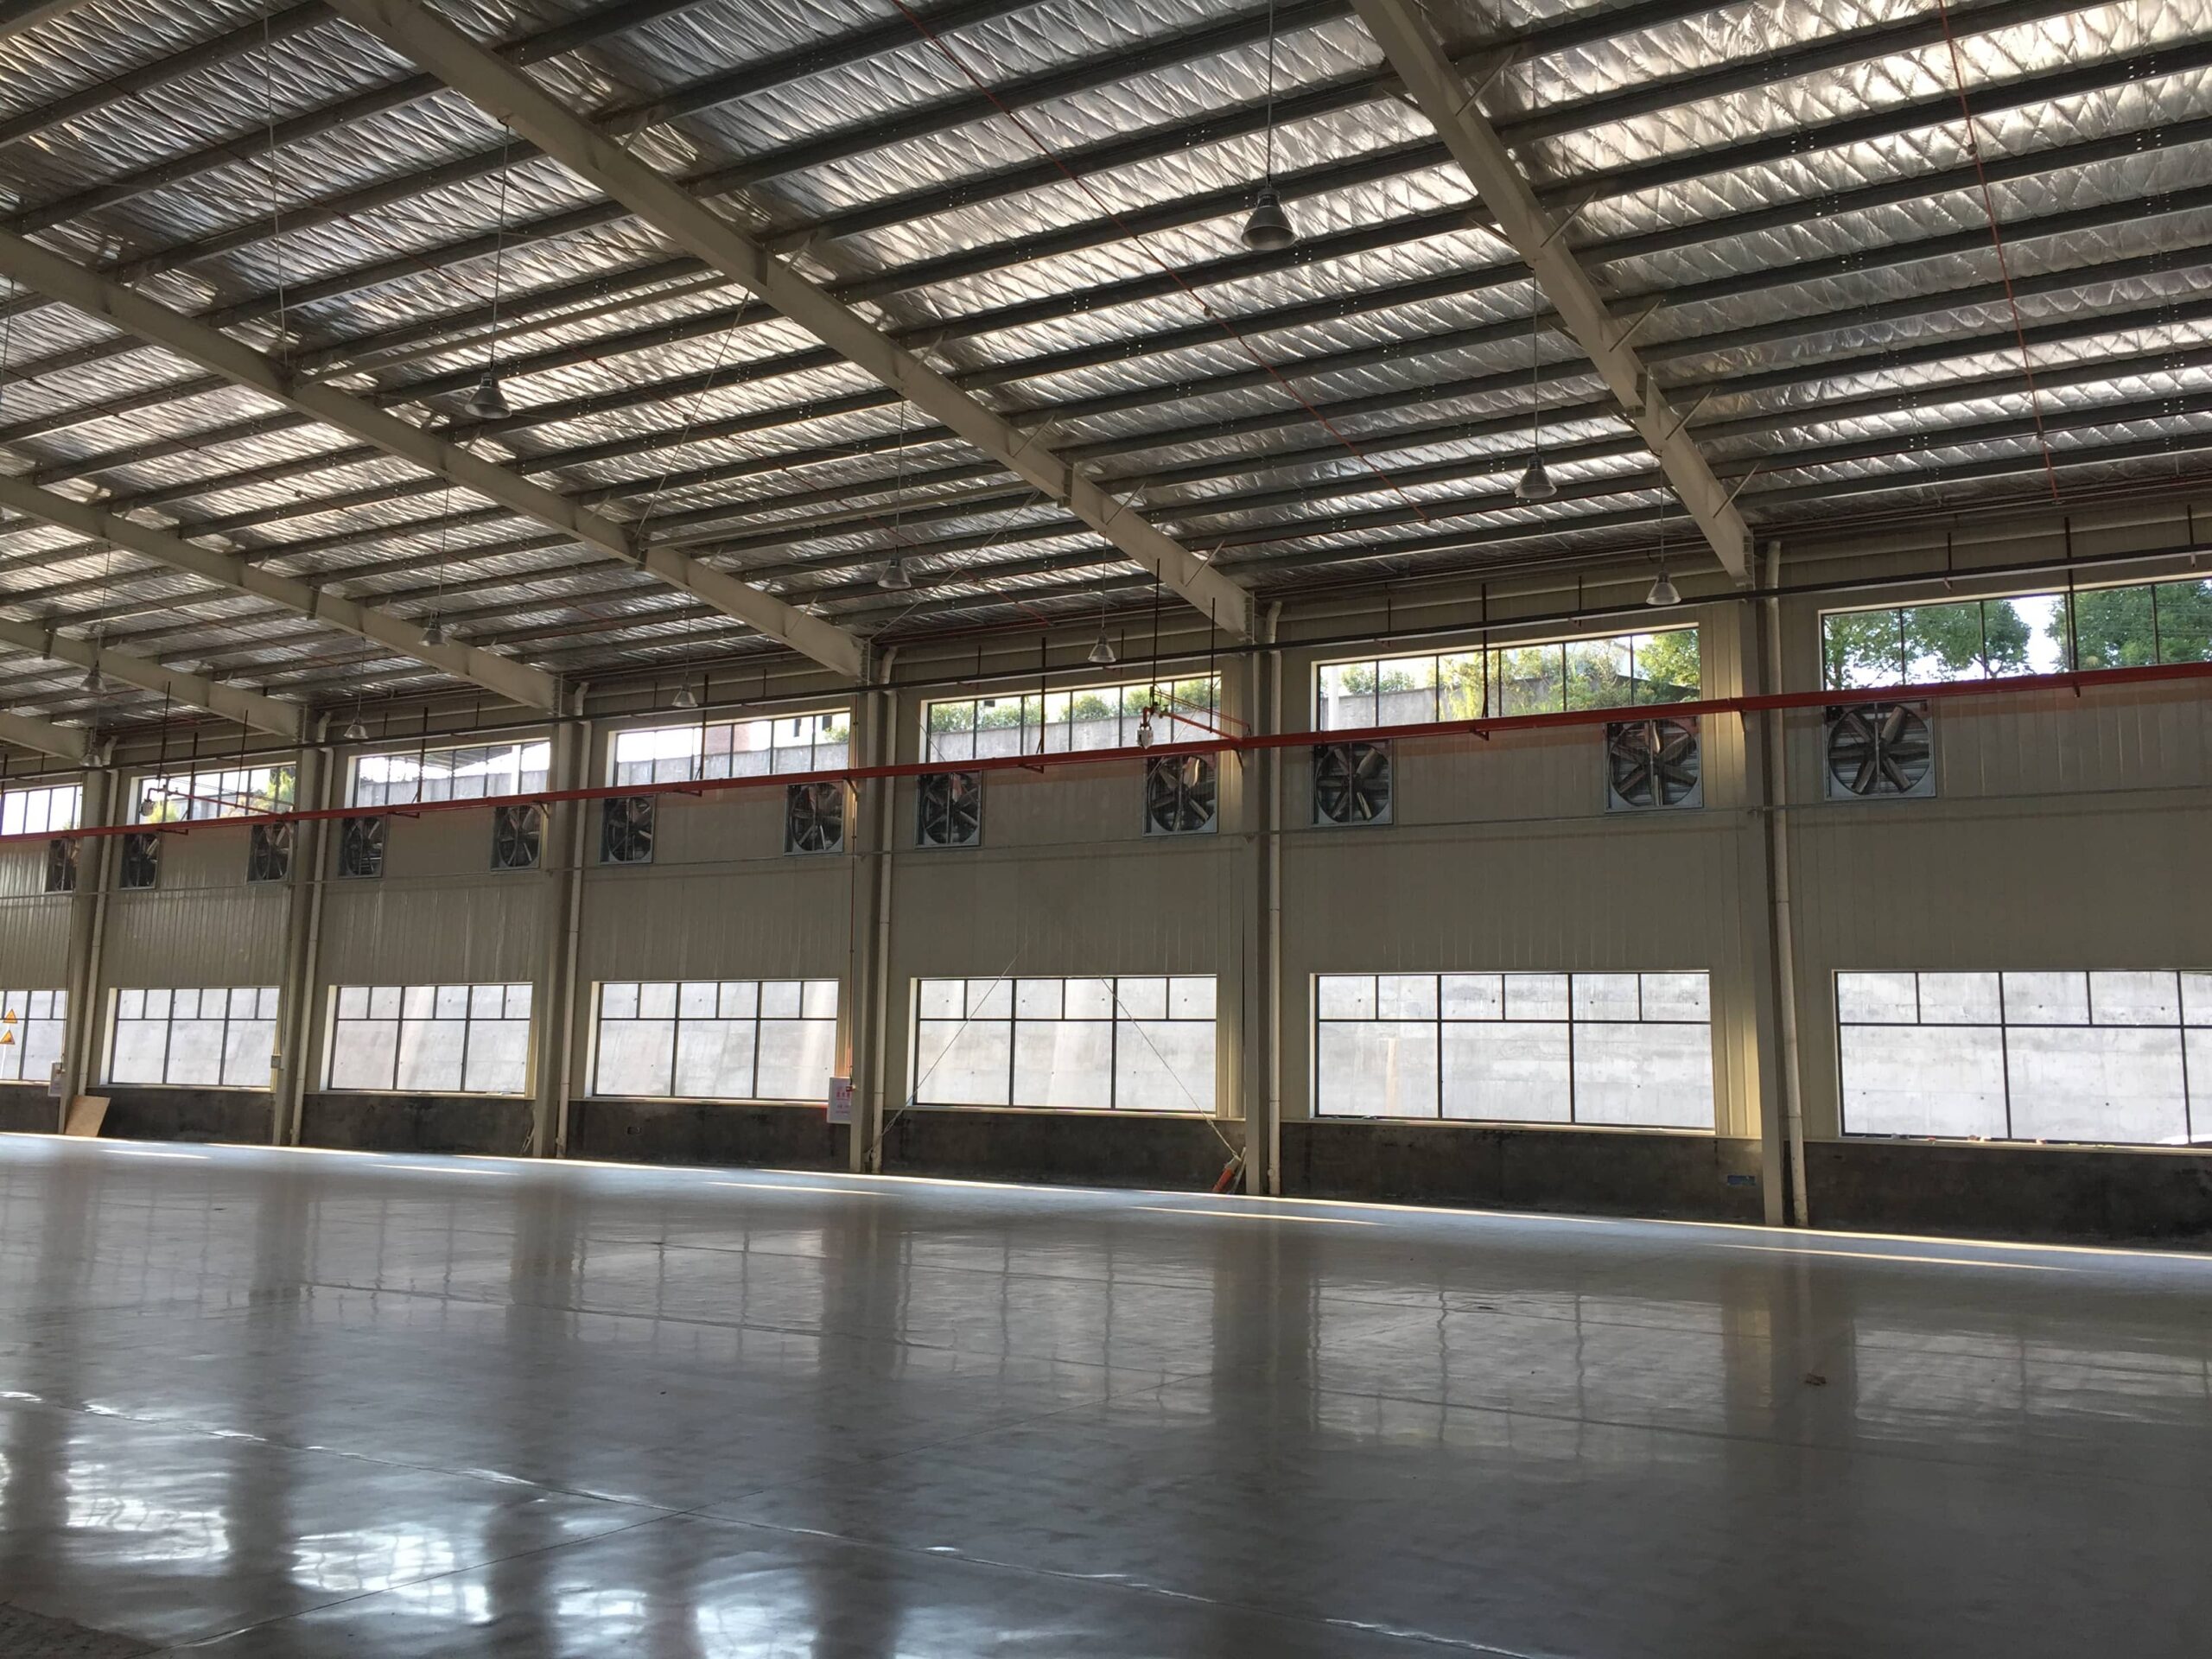
A fan rated at 30,000 m³/h may deliver much less airflow after installation. The rating might be measured in free air. Add a duct or cooling pad, and the actual airflow can change significantly.
Airflow must be evaluated together with static pressure. An industrial fan curve connects those values and shows where a fan can actually operate.
What Are Airflow and Static Pressure?
One value measures how much air moves. The other represents what the fan must overcome.
Airflow Measures the Volume of Air Moved
Airflow is commonly expressed in m³/h (CMH) or CFM. A hot workshop may require sufficient airflow to remove process heat. A welding area needs source capture plus general exhaust. Air changes per hour provide an early estimate, but a building with heat-treatment machines may need far more airflow than its volume suggests.
Static Pressure Represents Resistance to Air Movement
Static pressure is expressed in pascals or inches of water gauge. It reflects resistance in the air path. Duct creates some loss. Bends, filters, louvers, and cooling media add more.
A fan does not deliver its rated volume through every system. As resistance rises, delivered airflow usually falls. This is why a factory ventilation and cooling solution must be evaluated as a complete air path rather than a collection of individual components.
Static Pressure vs. Airflow on a Fan Curve
A fan curve places airflow on the horizontal axis and static pressure on the vertical axis. The curve normally slopes downward: airflow increases as system resistance decreases.
The far-right point represents free-air delivery with almost no external resistance. At the opposite end is shut-off pressure, where useful airflow approaches zero. Neither point is normally a suitable design target.
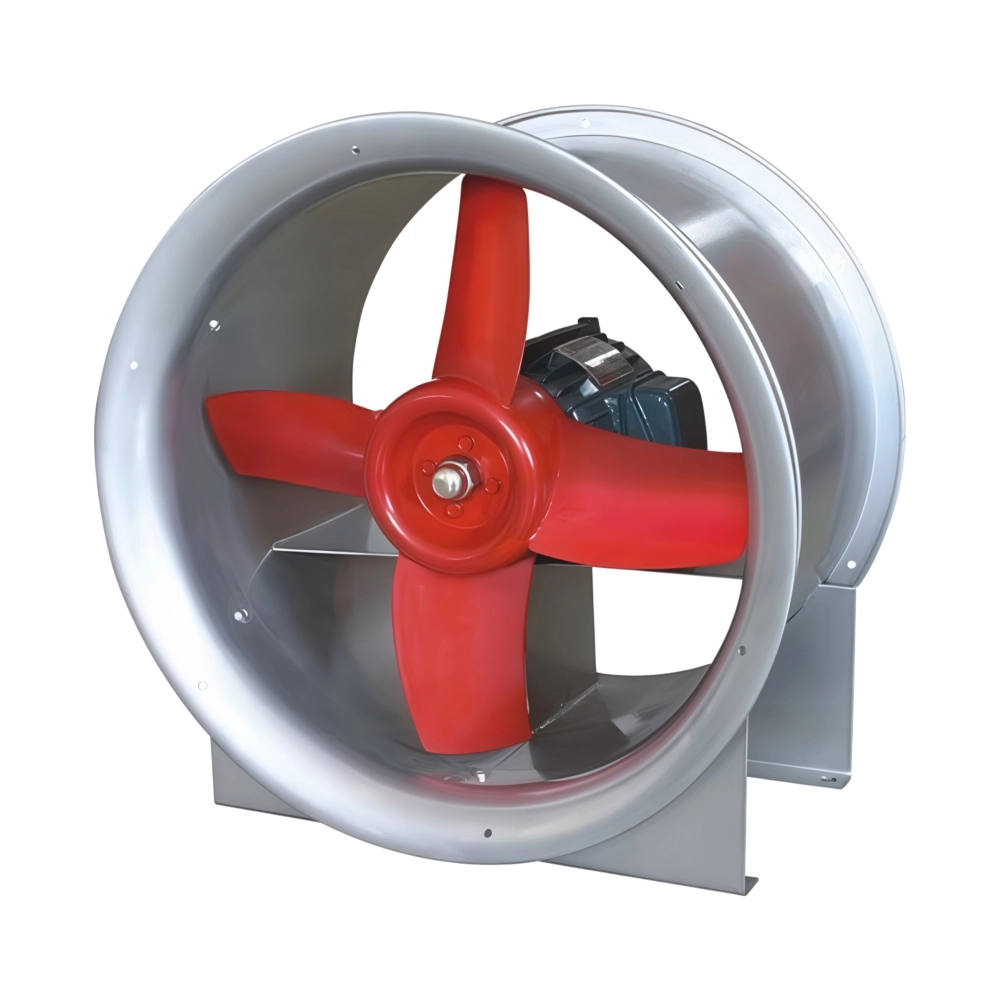
The operating point should fall within a stable region with acceptable efficiency and motor load. A T35-11 industrial axial flow fan will not have the pressure characteristics of a centrifugal fan.
How to Read an Industrial Fan Curve Step by Step
Reading the curve starts with a duty point, not the largest number on a data sheet.
Step 1 — Identify the Required Airflow
Start by defining the required airflow and its purpose. Building-volume calculations set a baseline. Process exhaust may be governed by capture velocity. Heat removal needs an estimated sensible heat load and allowable temperature rise.
Use the requirement that governs the design. Ten air changes per hour will not necessarily solve a concentrated heat load near a production line.
Step 2 — Estimate Total System Static Pressure
Add every significant pressure loss at the design airflow: intake openings, duct, elbows, transitions, louvers, and filters. Cooling-pad resistance changes with face velocity and condition.
Pressure loss increases with airflow. Check component data at the proposed operating condition. A clean-filter allowance based only on a clean filter may be insufficient in a dusty workshop.
Step 3 — Locate the Required Duty Point
Find the required airflow on the horizontal axis. Move vertically to the calculated static pressure. That coordinate is the duty point.
The selected fan curve should pass through or close to this point. If the curve falls below it, the fan cannot provide both requirements. A larger free-air rating does not repair that mismatch.
Step 4 — Check Efficiency and Motor Power
Confirm that the duty point lies in a stable region. Check absorbed power against the motor rating. Review efficiency and noise. A modest motor margin is sensible but excessive oversizing can increase capital cost and can make control difficult.
Fan Curve and System Curve: Finding the Real Operating Point
The fan curve describes fan performance. The system curve describes the installation. Their intersection is the operating point.
System resistance generally changes with the square of airflow. If airflow doubles, pressure loss can increase by roughly four times.
If system resistance is underestimated, the point left and airflow drops. On site, extraction becomes weak at the far end of a duct. A workshop may remain hot despite running every fan. Reducing resistance shifts the point right, though motor load needs another check.
A 4-72 centrifugal fan often suits a ducted system with meaningful resistance. An axial fan works well where high volume is needed against lower pressure. The fan curve should determine the selection, not the product label alone.
Practical Example: Selecting a Fan for a Factory Exhaust System
Consider a workshop that requires 30,000 m³/h at an estimated 180 Pa. These figures are illustrative assumptions.
Fan A is advertised at 30,000 m³/h in free air. Its curve shows only 22,500 m³/h at 180 Pa. Fan B reaches 30,000 m³/h at that pressure near its efficient range. It meets the design requirement despite having the same nominal airflow.
Fan A would leave a 25% airflow shortfall. Heat removal would be slower. Fume capture could become unreliable. Adding another fan later may also disturb pressure balance.
Fan B still needs motor and noise checks. If corrosion is present, material selection must also be considered. An FRP axial-flow rooftop fan may suit conditions that quickly damage unprotected carbon steel.
Common Fan Curve Selection Mistakes
Poor selections often trace back to missing system information. Common errors include:
- Selecting by maximum airflow alone.
- Ignoring pressure loss from louvers or cooling pads.
- Using duct loss calculated at a different airflow.
- Confusing static pressure with total pressure.
- Operating near an unstable end of the curve.
- Oversizing without checking energy use.
- Comparing data measured under different test standards.
- Allowing nothing for dirty filters or aging media.
What Information Should You Give an Industrial Fan Supplier?
A useful quotation needs more than building area and fan diameter. Provide design airflow, estimated static pressure, duct layout, and installation location. Identify filters or cooling pads.
State the temperature, humidity, airborne contaminants, power supply, noise limit, and control requirement. Site drawings or photographs can also reveal installation restrictions that may be missed in a written request.
Select a Fan Based on Actual Operating Conditions
DAIHO Ventilation manufactures industrial fans and integrates ventilation with evaporative cooling or air-treatment equipment. Selection is based on the duty point and complete system resistance.
Contact DAIHO Ventilation and send the airflow target, facility dimensions, and installation conditions. The technical review should answer one practical question: how much airflow will the fan deliver under actual operating conditions?
Frequently Asked Questions
Q: Does higher static pressure mean better airflow?
No. Static pressure represents the resistance the fan must overcome. On a given fan curve, airflow normally decreases as required pressure increases. Both values must match the duty point.
Q: Can two fans with the same airflow rating perform differently?
Yes. Their free-air ratings may be similar while their performance at 150 or 200 Pa can differ significantly. Compare complete curves under the same test conditions.
Q: How much safety margin should be added to static pressure?
There is no universal percentage. The margin should reflect calculation uncertainty and expected fouling. Excessive allowance can push selection toward an inefficient oversized fan.
Q: What changes the fan operating point after installation?
Damper position, filter loading, duct modifications, and blocked inlets can all change system resistance. The operating point moves wherever the revised system curve intersects the fan curve.
 English
  Russian
  Arabic
  Spanish
  French
  Italian